The educational system values and uses data to inform everything from the evaluation of individual students and entire school districts to educator’s performance-based pay and the success of curriculum. Teachers play a role in every single one of those decisions, yet teachers are often not comfortable with data analysis. In fact, 72% of districts cited lack of teacher preparation as a barrier to increased use of data systems. With so many benefits of digital data collection (think less time on IEP documentation!) it is vital that teachers, specifically special educators, start increasing their understanding of data-based decision-making.
Here are 5 simple steps you can make towards becoming a data analyst AND a better teacher:
- Write measurable goals and objectives
- Develop a data collection system and collect data
- Represent the data visually (usually with a graph)
- Evaluate the data
- Adjust instruction as guided by the data
Step 3 is an important one: Represent the data visually (usually with a graph)
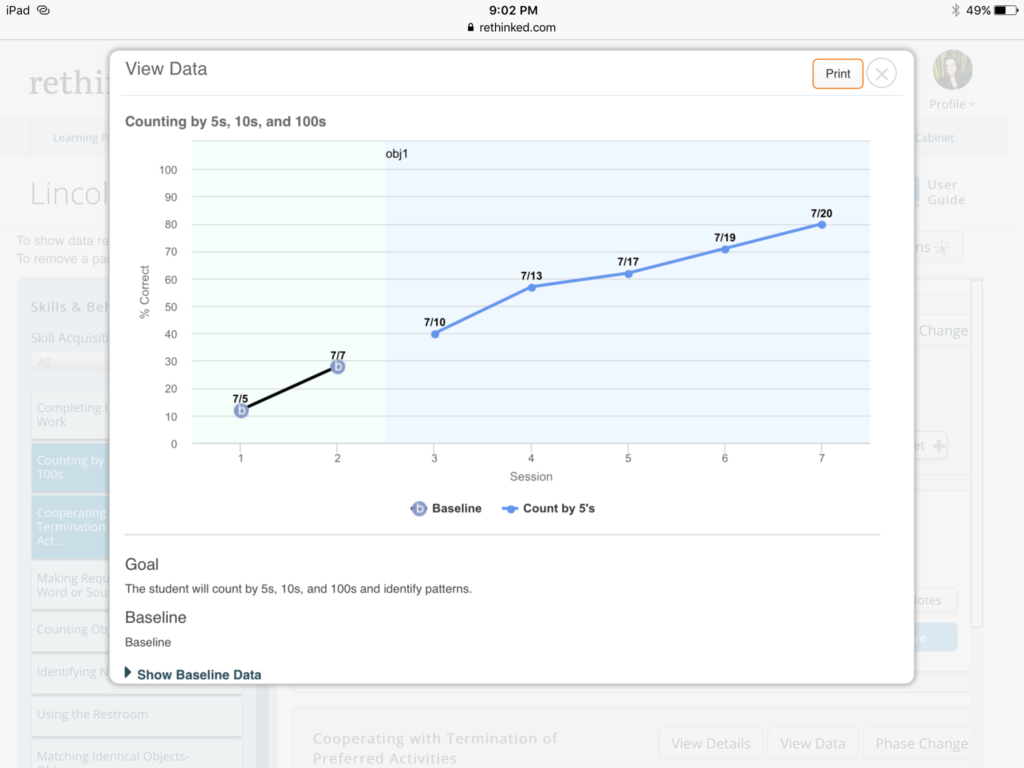
It is difficult to analyze data if it is not represented visually. Graphs help define what is happening. For example, graph one instantly demonstrates the progress and learning a student is making.

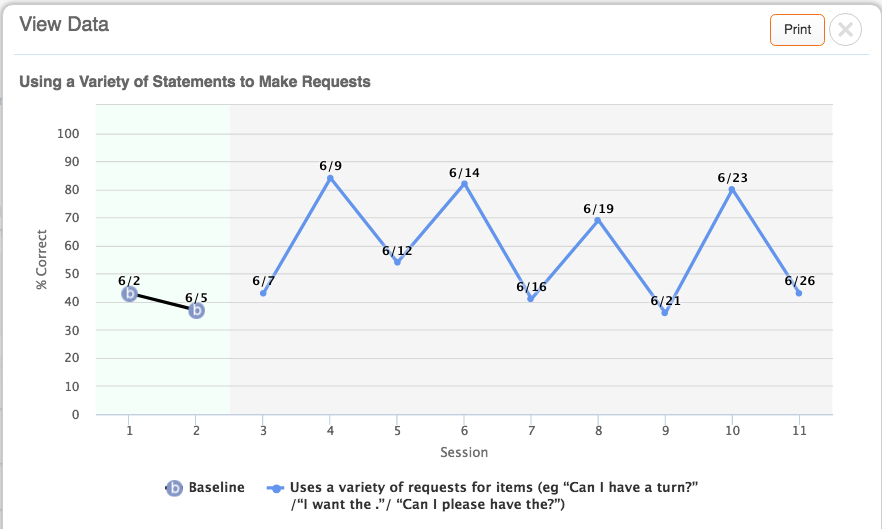
In the graph below, we can quickly determine that the students’ performance is variable and learning really isn’t occurring. With graphs you can evaluate the data (step 4) and adjust instruction (step 5) as guided by the data to better meet student needs. In this below example, the teacher can look at the instructional experience the student is having and discern what is inhibiting his learning.

Graph your data – become a data analyst!


