It’s no secret that data can be daunting. For some of us, the word “data” means pile-high clipboards and stacks of complex data sheets or binders of reports. Data can also feel like never-ending lists of impersonal statistics that are difficult to difficult to comprehend and cumbersome to analyze.
When we look at data through this lens, it becomes impossible to see how data can improve student performance and enhance holistic education practices, but it can. So let’s break it down.
In it’s simplest form, data is a collection of facts and statistics that can be used for planning or analysis. All educators are charged with ensuring they use data to inform instruction, so students benefit from evidence-based techniques and approaches to education. Data can also be helpful in monitoring student progress and identifying areas of need through baseline assessments.
Pre-tests, homework, attendance, grades and test scores are all data sources that help inform classroom, school and district decisions.
What is baseline data and how is it collected?
The definition of baseline data is a measurement that is collected prior to intervention or teaching starting. It can be collected through various measures including: percent accuracy, frequency, duration, rate and intervals. When selecting a measure of baseline data collection, it is important to consider how intervention or instructional data will be collected to ensure consistency.
Types and examples of baseline data
Percent accuracy
Percent accuracy is collected by calculating the number of target responses divided by the total number of opportunities. Some examples of this percent accuracy data include:
- Percentage of spelling words spelled correctly
- Percentage of correct math problems
- Percentage of items correctly identified
Frequency
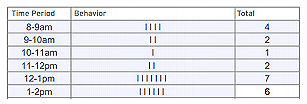
You can record frequency by tracking the number of each instance of a behavior. Collect frequency data with counters, tallies or a similar technique. Some frequency data collection examples include:
- Number of words read
- Number of times a student gets out of their seat
- Number of times students raise their hands
Duration
Duration is measured by tracking how long a behavior occurs. To record duration, start a timer when the behavior commences and stop the timer when the behavior ceases. Some examples of duration baseline data include:
- How long a child engages in tantrum behavior
- How long a child engages in peer interactions
- How long it takes to complete lesson plans for one week
Rate
Rate is calculated by recording the number of behaviors per unit of time. Some rate baseline data examples include:
- Number of words read per minute
- Number of math problems completed per minute
- Number of tantrums per hour
Interval data
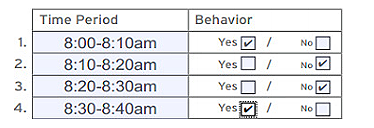
Interval data can be used when tracking each occurrence of behavior is not possible, or when the start and end time of the behavior is not clear. You can also use interval data to obtain a sampling rather than an exact count. Also you can measure interval data by determining a preset time interval and then marking whether the behavior occurred during that interval. Some examples of this interval baseline data include:
- The occurrence of body rocking
- The occurrence of staying in an assigned area
- The occurrence of off-task behavior
Case Study: North East ISD

Download the Case Study: Using Data to Drive Instruction and Inform Families (North East Independent School District, San Antonio, TX)
Learn how North East ISD started with a small, strategic implementation and over two years expanded implementation to include every special education teacher in the district so they could progress monitor student development.
Why is baseline data important and when is it used?
Without baseline data, many educators run the risk of failing to show progress in a number of student populations, such as with at-risk students, English language learners or students with disabilities.
Baseline data should always serve as a starting point for instruction. It justifies the need for behavioral intervention plans and allows for shifts in instruction that help every student achieve progress. It helps educators choose the right skill-building activities for students and makes it more likely that students will succeed.
With baseline data, educators can essentially create a roadmap for students to achieve their educational goals and gain the support they need to master skills, lessons and more. Despite growing needs and changes in the educational landscape in America, baseline data continues to be a useful tool for educators to track and analyze student progress across the country. When you use data to guide instruction, there’s no telling what you’ll discover.
But one thing’s certain: You’ll create a dynamic and individualized experience your classroom that will move your students and school forward.
How to collect baseline data in the classroom
There are a variety of methods to collect baseline data for the classroom, including pre-tests, homework, attendance, grades and test scores as mentioned. Here are some more tips and example of baseline data to help:
- 3 Tips for Making Data-Based Decisions like a Pro!
- Using Baseline Data and Information to Set SLO Targets
- SLO Example Baseline Rationale Teacher
- Recommended Methods of Establishing Baseline for Truancy Rates
If you would like to learn more, contact us with any questions you have on how to collect or use baseline data to help make informed decisions for your classroom, school and district.


